n <- floor(runif(1000)*10)
t <- table(n)
barplot(t)
Overview
The first line generates a list of random numbers.
The table function counts the number of
occurences for each generated number.
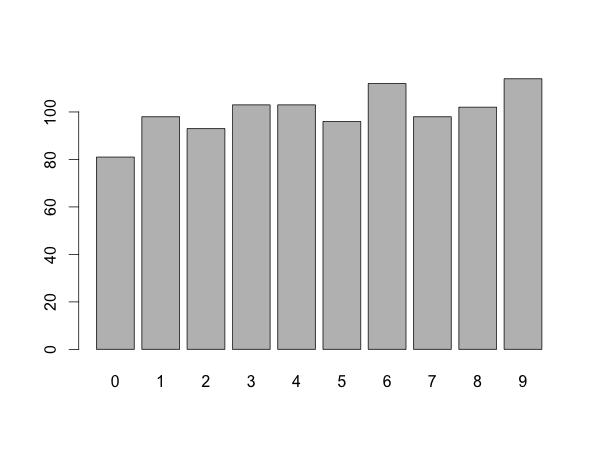
barplot creates a bar chart based on the table data.
Getting the random numbers
runif will generate 1000 uniformly distributed numbers between 0 and 1. Because we multiply by 10 we get numbers between 0 and 10.
runif(1000)*10
[1] 7.346433511 5.560346758 0.762020829 2.611504081 6.582468385 9.571311316
[...]
[997] 8.736503848 6.504455155 5.203101230 9.900331229
The floor function removes the digits after the decimal point, so we only get natural numbers between 0 and 9.
floor(runif(1000)*10)
[1] 4 4 7 5 6 4 7 6 3 3 4 5 6 3 3 8 0 3 8 4 7 0 3 9 7 4 9 7 1 2 5 6 5 3 1 5 3
[...]
[963] 7 3 9 9 9 3 1 1 6 3 3 3 9 4 5 1 5 9 2 8 3 6 2 3 4 0 8 7 5 2 9 0 0 0 1 3 4
[1000] 3
Counting value occurrences with table
table(n)
n
  0   1   2   3   4   5   6   7   8   9
 98  98  99 102 111 105  88 103 101  95
Plotting the data with barplot
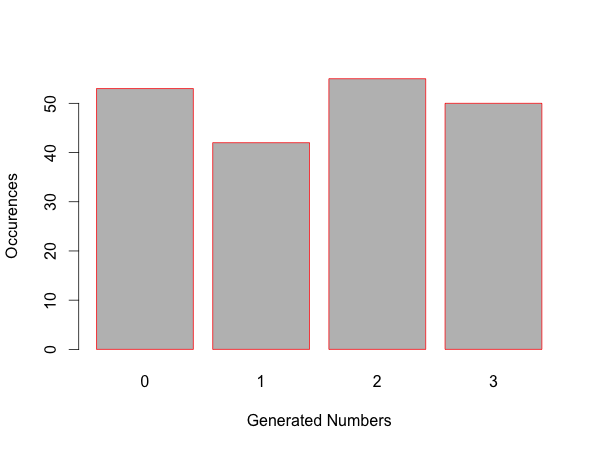
Once you have a table using barplot is really straightforward. Use the documentation if you want to specify the plot size or add axis labels.
barplot(table(floor(runif(200)*4)), xlab="Generated Numbers", ylab="Occurrences", border="red")